This is the second article in a series where I plan to go over on how to avoid 24×7 support in your organization, be sure to read the first post where I talk about what you should be logging in the first place.
Let’s recap the logging pipeline first:

In this article we are going to go through the Elastic Search and Kibana part.
UPDATE: The article originally was a walk-through for AWS Elastic Search 2.3, since AWS started supporting 5.1 after 1 week of my posting this article, I have updated the post to use 5.1 as well.
Choose your evil
There are three options that you have if you want Elastic search on AWS:
- Get an EC2, install on your own, Elastic.co has written a simple and comprehensive article on this, so I am not going to repeat.
- Get a third party managed Elastic search as a service, again Elastic.co is pretty good for that, Compose is another competitor.
- Get the AWS elastic search as a service.
There is a reason why I said choose your evil as none of these options are perfect, let me go through a few pro’s and con’s of these approaches:
| ES on EC2 Instance | Managed ES | ES Service from AWS |
|---|---|---|
| Complete control on the install, whatever version / plugin you want | Less control, however lesser worries, companies dedicated to providing this service will do a good job at it as it is their bread and butter | Limited control, only versions that AWS supports (1.5, 2.3 & 5.1 at the time of writing this article), plugins are limited to the following currently (for version 5.1):
No dynamic scripting support |
| Least expensive from the infrastructure point of view, most expensive in terms of the expertise that you need to maintain this | Most expensive, whatever you get is generally worry free, you only worry about the predictable bill at the end of the month | Medium expensive however, not by much, you get stuff like infrastructure portability by simply clicking to increase cluster size, basic configurations done right from the beginning, good metrics available from the get go to analyze health, automated backups (this is gold) |
| You can have it on a private IP, basically connect through VPC, hence the connection is fastest | Generally connection is through internet | AWS at the time of writing this article did not support a VPC endpoint for the ES service, this means you go through the internet gateway, the connection however is good as AWS handles requests entering its domain well via the gateway. You can restrict access via whitelisting IP’s if you use auto-scaling, you should still be able to do that if you use a NAT service, comment below if you want more details on how to do this |
| Ideal only for advanced use cases where core application logic resides in elastic search and you want custom capabilities | Ideal for non-AWS hosted solutions, or for companies with very limited DevOps capabilties | Ideal for non-critical path workloads like logging/analytics etc |
Setting up AWS’s Elastic Search as a Service
Defining domain name & ES version
Give your ES a domain name, I recommend giving environment-appName-purpose, choose your ES version here, choose the latest version (5.1 at the time of writing this article), 1.5 has some known issues, don’t choose that.

Cluster sizing
Instance count defines the number of VM’s you want your ES to be sharded across, provide at least two in production environments to provide enough redundancy. I will be creating a micro node with no dedicated master for this article.
Instance type Choosing your instance type requires some thought and I wrote a dedicated post for that here, for elastic search, I recommend choosing the I series instances as they come with instance storage which is the fastest, for this demo I will choose the free tier eligible t2.small one (minimum & free-tier eligible for version 5.1).

Enabling dedicated master, dedicated masters in ES are basically nodes which hold no data by themselves however perform admin tasks such as deciding which nodes hold which shards, creating or deleting indexes etc, to learn more about master nodes, here is the documentation by the elastic search team. Choose at least 3 master nodes for maximum stability and avoiding the split-brain problem.
Enable zone awareness distributes your instances across different availability zones, this ensures protection from any AWS outage that might occur. You need even number of data nodes in order to enable this. I will talk about setting up replicas later in this article.

Storage Configuration defines the amount of storage memory (hard-disk) that your instances will have, for production I recommend instance storage (with replication enabled only as that’s volatile) as its the fastest by far and keeps your ES nodes healthy. However, if you choose an instance type which does not have an instance storage option, you can choose EBS as shown below (t2 instances do not have instance storage).
Automated snapshots This creates auto backups of your cluster as a backup on a daily basis and stores it for 14 days (at no extra charge). Choose a time when your traffic is lowest, AWS says no downtime however the cluster slows down heavily when this backup is happening.

Url based access control this is controlled by the badly named rest.action.multi.allow_explicit_index heading. Keep this true by default unless you have that specific requirement, read this ES documention for further know-how on this one.
Field data size limiting (indices.fielddata.cache.size) for anything but log storage, you should leave this unbounded, however, as we are in fact talking about using ES to store logs here, set this to 40 (percent), this makes sure older log data fielddata cache is evicted so that your node keeps stable.

Setting up access policy Here we will define the security for your node. Unfortunately as I wrote in the comparison table before AWS yet did not give VPC access to your nodes, in production environment I recommend setting up a NAT gateway and authorizing access from that. For this article though see the screenshots where I set up access from a specific instance that I have created for demo purposes.


In the next screen you get to review your settings, after you have done the latter, click on the Confirm and Create button, we’ll learn how to setup replica’s before we move to the next section.
Setting up ES replica’s via AWS API
In production environments you would want to set up replication to prevent any loss of data in case any one (or multiple nodes) go down, expect this to happen for whatever reason (too much load, bad ES configuration, AWS issues etc). To setup replication, you can use the ES REST API.
Name of indexes must be in lower case
PUT eventlogs_2017_01
{
    "settings" : {
        "index" : {
            "number_of_shards" : 4,
            "number_of_replicas" : 2
        }
    }
}
Here is a fiddler example:
PUT https://search-mytestdomain-53fhvuzblj3d75brpnxxx.us-west-2.es.amazonaws.com/eventlogs_2017_01 HTTP/1.1
User-Agent: Fiddler
content-type: application/json
Host: search-mytestdomain-53fhvuzblj3d75brpnxxx.us-west-2.es.amazonaws.com
Content-Length: 140

{
    "settings" : {
        "index" : {
            "number_of_shards" : 4,
            "number_of_replicas" : 2
        }
    }
}
for our test micro instance, these shards and replicas are a bit much for it to handle, so just for demo purposes, we’ll fire this instead:
PUT eventlogs_2017_01
{
    "settings" : {
        "index" : {
            "number_of_shards" : 1,
            "number_of_replicas" : 0
        }
    }
}
An index is basically a placeholder for a particular type of data (application event logs, exceptions, server events) and is split into multiple shards. Shards have a maintenance overhead, so its important to have the correct number of shards in the system to parellelize and distribute data efficiently while minimizing the number of shards required in order to avoid unnecessary overheads. I recommend putting 4 shards in a day (a shard for roughly every 6 hours of evenly distributed data).
For the purpose of logging, it is imperative that you have rotating
time-based indexes, basically creating an index per time-frame, start
by creating an index for a month and go to daily indexes if your log
data size is huge.
Having smaller indexes makes your queries faster, deletions of older log data simple and fast, at the same time it keeps your servers from going out of memory when searching through huge chunks of log data which is forever adding up. Configuring daily indices will be part of a future article where I will talk about building a log data pipeline, for now you can manually create these indexes, or since indexes can be created in an idempotent way, simply change the index name every day from where your data is being inserted into ES (see writing data to the ES cluster below).
Check out the Elastic Search service FAQ’s at AWS site here.
Writing data to the ES cluster
Elastic search clients are available in various programming languages, you can find a list of official clients at the Elastic search site here.
For any other purpose other than putting logs into ES, using the clients is non-optional, however, specifically for the logs use case I recommend not putting stuff directly into ES, Kinesis firehose is a good option to use in this case, I’ll talk about that in detail in a future article.
Let’s create some dummy data into the index that we created above, so that we have something to look at when we go into the next section where we search and build graphs on these logs:
- Download the dummy log file that I created.
- Send a post to the elastic bulk REST API as below:
POST https://search-mytestdomain-53fhvuzblj3d75brpnxxx.us-west-2.es.amazonaws.com/_bulk HTTP/1.1
User-Agent: Fiddler
content-type: application/json

the file contents here downloaded from step 1>
For Elastic search 2.3 (not needed for 5.1), modify the Kibana 4 (5.1 will have Kibana 5) index to modify the max result window (workaround for this ES bug):
PUT .kibana-4/_settings
{
    "index" : {
        "number_of_replicas" : 0,
        "max_result_window" : 2147483647
    }
}
The above setting may take upto 10 minutes to reflect.
Looking at your logs (Micro Intro to Kibana)
Kibana is a data visualization tool, currently at version 5, with Kibana you can create custom dashboards visualizing logs in charts, tabular formats or even simple counter widgets. Let’s build a basic dashboard to get started.
Step 1
Find the Kibana URL at the AWS console’s Elastic Search service like in the screenshot below:

Step 2
Configure Kibana, put in the index name that we created before, when you have time-based indexes as I wrote earlier you can also put in a pattern for the index here.

Step 3
Go to the discover tab, you should see something like this (if you see no results found, change the time range from top-right corner to 1 year, our test data was added in the past):
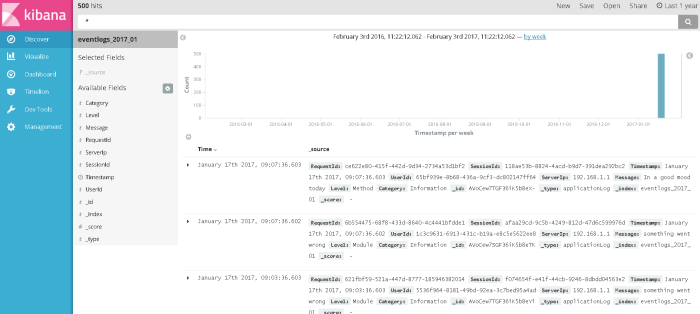
For ES 2.3 and Kibana 4: If you see an error on this screen, just wait for around 10 minutes and try again, its due to the ES bug I had mentioned earlier which we fixed with Step 3 of creating dummy data.
Step 4
Create a visualization, each visualization is a widget which can then be added to a dashboard later, in this case let’s create a simple pie chart depicting the source of logs by server’s IP address:

Step 5
Choose new search, searches can be saved on the basis of which different visualizations can be created such as pie/line charts/tabular data

Click on the save button at the top bar as shown in the image, put in a title and click save.
Step 6
Go to the dashboard tab, click on the Add button at the top bar and then add your visualization and save the dashboard, see image for details.

Don’t forget to save this dashboard (top bar button).
That’s it! I’ll let you experiment with creating more dashboards, the data that I have provided can be used to create a good demo to convince the approvers for using ElasticSearch :-).
Summary
In this blog post, we learned how to:
- Choose ES deployment type
- Create a ES cluster using AWS elastic search service and doing some basic settings
- Use Kibana 5 at a basic level
Following are left in order to conclude on how to stop 24×7 support to your application :-), let me know by commenting below if there is anything specific you want me to talk about first:
- Log data pipeline (you don’t want to put stuff directly into ES)
- SNS integration with Pagerduty / emails for real-time alerts which rings your phone
- Backup monitoring to monitor Elastic search to build a fool proof auto-alert system
And of course, follow this blog/subscribe to email alerts (top of sidebar or below comments in mobile) so that you know when any of these posts come about.


Pingback: What should you log in an application and how to avoid having 24×7 support looking at them? | cloudncode
Pingback: Getting started with writing and debugging AWS Lambda Function with Visual Studio Code | cloudncode
Hi Sumit Maingi, great article!
I am using ES in AWS but I am not sure if I have to migrate to Elastic.CO. I am using ES for searching users, like a social network. Why do you AWS ES service for non-critical path workloads like logging/analytics ?
LikeLike
AWS elastic search service is awesome for logging etc… However for business functionality it suffers because:
1) No option for custom plugins, you never what you will need and this is limiting.
2) no scripting support to make some queries a lot faster, again you might not need them today but you don’t want to be in a position where you want it but can’t have it.
3) no private ip access (VPC)
4) you will be limited by the ES version that AWS supports they recently started supporting 5.1, but it takes away the flexibility that you may want.
Having said the above, If you feel that your requirements are simple or AWS ES service has everything you need and you don’t expect your needs to expand you can always try it out.
LikeLike
Pingback: Scaling for TB level log data with Kinesis Firehose and lambda with Elastic Search on AWS | cloudncode
Pingback: Best practices – AWS Lambda function | cloudncode
Is it possible to run Kibana 5.1 on a separate EC2 instance? If so, how do you configure the yml file on the Kibana server? I’ve experimented with this but could never get it to work.
LikeLike
You can ignore the question. You have to specify the port, specifically port 80 after the elasticsearch URL.
LikeLike
Cool, thanks for updating
LikeLike
I am using AWS Elasticsearch service with 5.1 version.
I have separate installation of kibana 5.1.1 with x-pack.
My Kibana is not coming up, giving Authorization Exception
As per forum https://forums.aws.amazon.com/thread.jspa?threadID=248200, Amazon ES does not support x-pack plugin.
Now How do i create users in kibana
Below are the Logs on Kibana Terminal:
log [07:54:06.223] [error][status][plugin:xpack_main@5.1.1] Status changed from yellow to red – Authorization Exception
log [07:54:06.224] [error][status][plugin:graph@5.1.1] Status changed from yellow to red – Authorization Exception
log [07:54:06.224] [error][status][plugin:reporting@5.1.1] Status changed from yellow to red – Authorization Exception
log [07:54:06.225] [error][status][plugin:elasticsearch@5.1.1] Status changed from yellow to red – Authorization Exception
log [07:54:06.230] [error][status][plugin:security@5.1.1] Status changed from uninitialized to red – Authorization Exception
log [07:54:06.231] [warning][security] Generating a random key for xpack.security.encryptionKey. To prevent sessions from being invalidated on restart, please set xpack.security.encryptionKey in kibana.yml
log [07:54:06.234] [warning][security] Session cookies will be transmitted over insecure connections. This is not recommended.
log [07:54:06.279] [error][status][plugin:profiler@5.1.1] Status changed from uninitialized to red – Authorization Exception
LikeLike
I believe xpack is a plugin for ElasticSearch, you just setup Kibana for xpack to communicate with ES afterwards. Yes, AWS ES service currently does not support Xpack, if you want that you will have to go with either a self hosted solution or go for Elastic Search’s own hosted solution via AWS marketplace (recently launched) from here: https://aws.amazon.com/marketplace/pp/B01N6YCISK
LikeLike
@Sumit, Thanks for quick response.
It will be a tough task to host elasticsearch cluster on our own. My concern area is security only. That is why I was looking for some solution.
LikeLike
Hi Sumit,
Thanks for the great article.
We are trying to use ES Service from AWS along with Alfresco Activiti (client). From Activiti, we need to set parameter “elastic-search.discovery.hosts”, which should be all nodes’ hostname or IP address (such as [10.0.0.1, …., 10.0.05]). However, ES service doesn’t provide IPs for each node, only one server domain is available. This caused MasterNotDiscoveredException when we start Activiti. Any thought?
Thanks
LikeLike
On a vacation right now, I will try to answer your questions when I get back sometime next week. Apologies.
LikeLike
Hi Sumit,
We think the issue probably is caused by Elasticsearch version mismatch. Alfresco is using 1.7 while AWS ES service is 5.3. However, I will appreciate if you have any opinions on it.
Thank you
LikeLike
Thanks for the information.. I’ll give it a go next week
LikeLike
It seems like “Enabling dedicated master node” doesn’t have much meaning?
What’s the difference between
“Not enable dedicated master node” with “Enable it, but only 1 dedicated master node”?
LikeLike
Here is the Elastic.Co’s documentation on master nodes: https://www.elastic.co/guide/en/elasticsearch/reference/current/modules-node.html
Excerpts:
“The master node is responsible for lightweight cluster-wide actions such as creating or deleting an index, tracking which nodes are part of the cluster, and deciding which shards to allocate to which nodes. It is important for cluster health to have a stable master node.”
“By default a node is a master-eligible node and a data node, plus it can pre-process documents through ingest pipelines. This is very convenient for small clusters but, as the cluster grows, it becomes important to consider separating dedicated master-eligible nodes from dedicated data nodes.”
Basically dedicated master nodes bring more stability to clusters by making sure the essential role of a master node is not overshadowed by the resources required to store data. I recommend going heavy on CPU and RAM for master nodes with a good optimized network attached, big and performant disks are not required as such for master nodes.
LikeLike
So for example, even though i create a cluster with 5 nodes (with the hope that 3 nodes would be elected as master nodes), we can’t decide how many nodes would be elected as master nodes? Or it’s still only 1 node elected to be master node. And this master node still contain data? While “dedicated master node” absolutely don”t contain any data?
I guess since “dedicated master node” is located in different physical server, it might help in high-availability use-case, right?
LikeLike
i create a cluster with 5 nodes (with the hope that 3 nodes would be elected as master nodes: You control the number of master nodes by setting thenode.masterproperty totruesee the ES document I had linked before.“dedicated master node” absolutely don”t contain any data: Correctsince “dedicated master node” is located in different physical server, it might help in high-availability use-caseSort of, high availability is more directly achieved by the number of each type of node that you have whether they are ‘dedicated’ for one job or not, however. dedicated nodes are more reliable, so in a way, yes.Note: If you can live with (cost-wise) 5+ servers, I recommend 3 dedicated master nodes and at least 2 data nodes with number of replica a minimum of 1 and maximum of 4 depending upon the number of nodes you have and how precious the data is. Check out the documentation for the same here: https://www.elastic.co/guide/en/elasticsearch/guide/current/replica-shards.html
LikeLike